Cloud costs are rarely static, which means organizations must forecast and allocate their spending carefully to remain under budget. Most organizations miscalculate their cloud cost forecasts, however, and typically spend between 6% to 14% more on their actual cloud spend than predicted.
This is why cloud cost analysis is essential for any organization that relies on cloud platforms. An in-depth analysis can help produce a more complete picture of a company’s total cloud spend, and provide insights that lead to targeted cost optimization strategies. This guide covers cloud cost analysis in detail, from its business value to essential best practices.
| Table of Contents |
|---|
What is cloud cost analysis?
Cloud cost analysis is the process of tracking all costs related to cloud spending, and using this information to identify trends, anomalies, inefficiencies, or other insights. Every organization performs this analysis differently. Some may prioritize infrastructure analysis, like resource allocation and utilization, while others focus on business value metrics like usage patterns and workflows.
While cloud cost analysis is one of the first steps in the cloud cost optimization process, it’s not the same as optimization. An analysis only involves the tracking, visualization, and examination of cloud spending habits, while optimization leverages these insights to reduce cloud costs.
Cloud cost analysis is more than just a step in the cost optimization process, however. Organizations can use the information to streamline workflows, increase utilization, and reinvest savings in resources and workloads that provide the most value.
To reap maximum rewards from a cloud cost analysis, organizations should follow a few best practices.
Cloud cost analysis best practices
While all organizations execute cloud cost analyzes differently, following the five best practices listed below can help you obtain the most comprehensive and accurate spending insights.
Identify all cloud services in use
Account for every cloud cost, down to the most granular resource. Anything that slips through the cracks can pile up fees over time, leading to significant (and unnecessary) costs. Below are just a few examples of services, resources, and costs organizations should identify:
|
|
|---|---|
|
|
|
|
Use tagging and labeling
Tagging and labeling resources makes it easy to track cloud utilization over time. Some cloud platforms like Amazon Web Services (AWS) provide specific cost allocation tags for this purpose. Tracking these tags helps organizations find underutilized resources quickly to reallocate or delete them. Cost allocation tags also provide insights into which services provide the most value vs. those that needlessly drive up costs.
Use visualization and analytics tools
Cloud providers like Google Cloud Platform, AWS, and Microsoft Azure offer dashboards for users to visualize and analyze cloud costs; however, they don’t always provide the in-depth insights required to fully optimize costs. Organizations that use a multi-cloud environment need specialized tools to visualize all their expenses in one place.
Third-party cloud cost analysis tools provide multi-platform visualizations, customizable dashboards, and automated anomaly reports. Some tools even perform cost validations to ensure the accuracy of tracked costs.
To perform in-depth analyzes, look for visualization tools that:
- Show all compute resources in-use and how they’re being used.
- Create access performance profiles for workloads and data sets to improve performance.
- Forecast costs and performance for proposed changes to compute instance types, storage classes and lifecycle policies.
- Discover and display all unencrypted and publicly accessible data to minimize security risks.
- Prevent shadow access by showing what data is being accessed, by whom, and when.
- Identify over-provisioned access policies.
- Conduct audit trails that show every change.
- Allow users to enter prompts to generate specific visualizations quickly.
Continuously monitor and analyze costs
Cloud cost analysis requires frequent monitoring – at least once per month, but ideally more frequently. This helps keep costs as low as possible and improves utilization and data management workflows. Teams are more likely to tag resources properly and practice effective data governance when an organization performs monthly reviews.
At a minimum, organizations should perform the following monthly tasks:
- Review total cloud spend from the month prior.
- Create new budgets and forecasts.
- Set up alerts relevant to cloud spend goals or budgets.
- Analyze costs using cloud cost visualization tools.
- Look for opportunities to increase utilization and business value.
Identify trends and anomalies
Whenever possible, use tools that automate cloud cost analysis and trend identification. Some tools offer automated resource provisioning, data tiering, and tagging, which facilitates tracking patterns accurately. Likewise, tools that offer automated anomaly detection can send reports when usage unexpectedly spikes, allowing organizations to address these issues quickly.
It’s also important to coordinate with engineering teams on tracking trends and anomalies. Engineers understand cloud infrastructure and can verify whether an uptick or anomaly is expected, or requires immediate intervention.
To get the most value from these cloud cost analysis best practices, it’s important to use the right combination of effective analysis and data management tools.
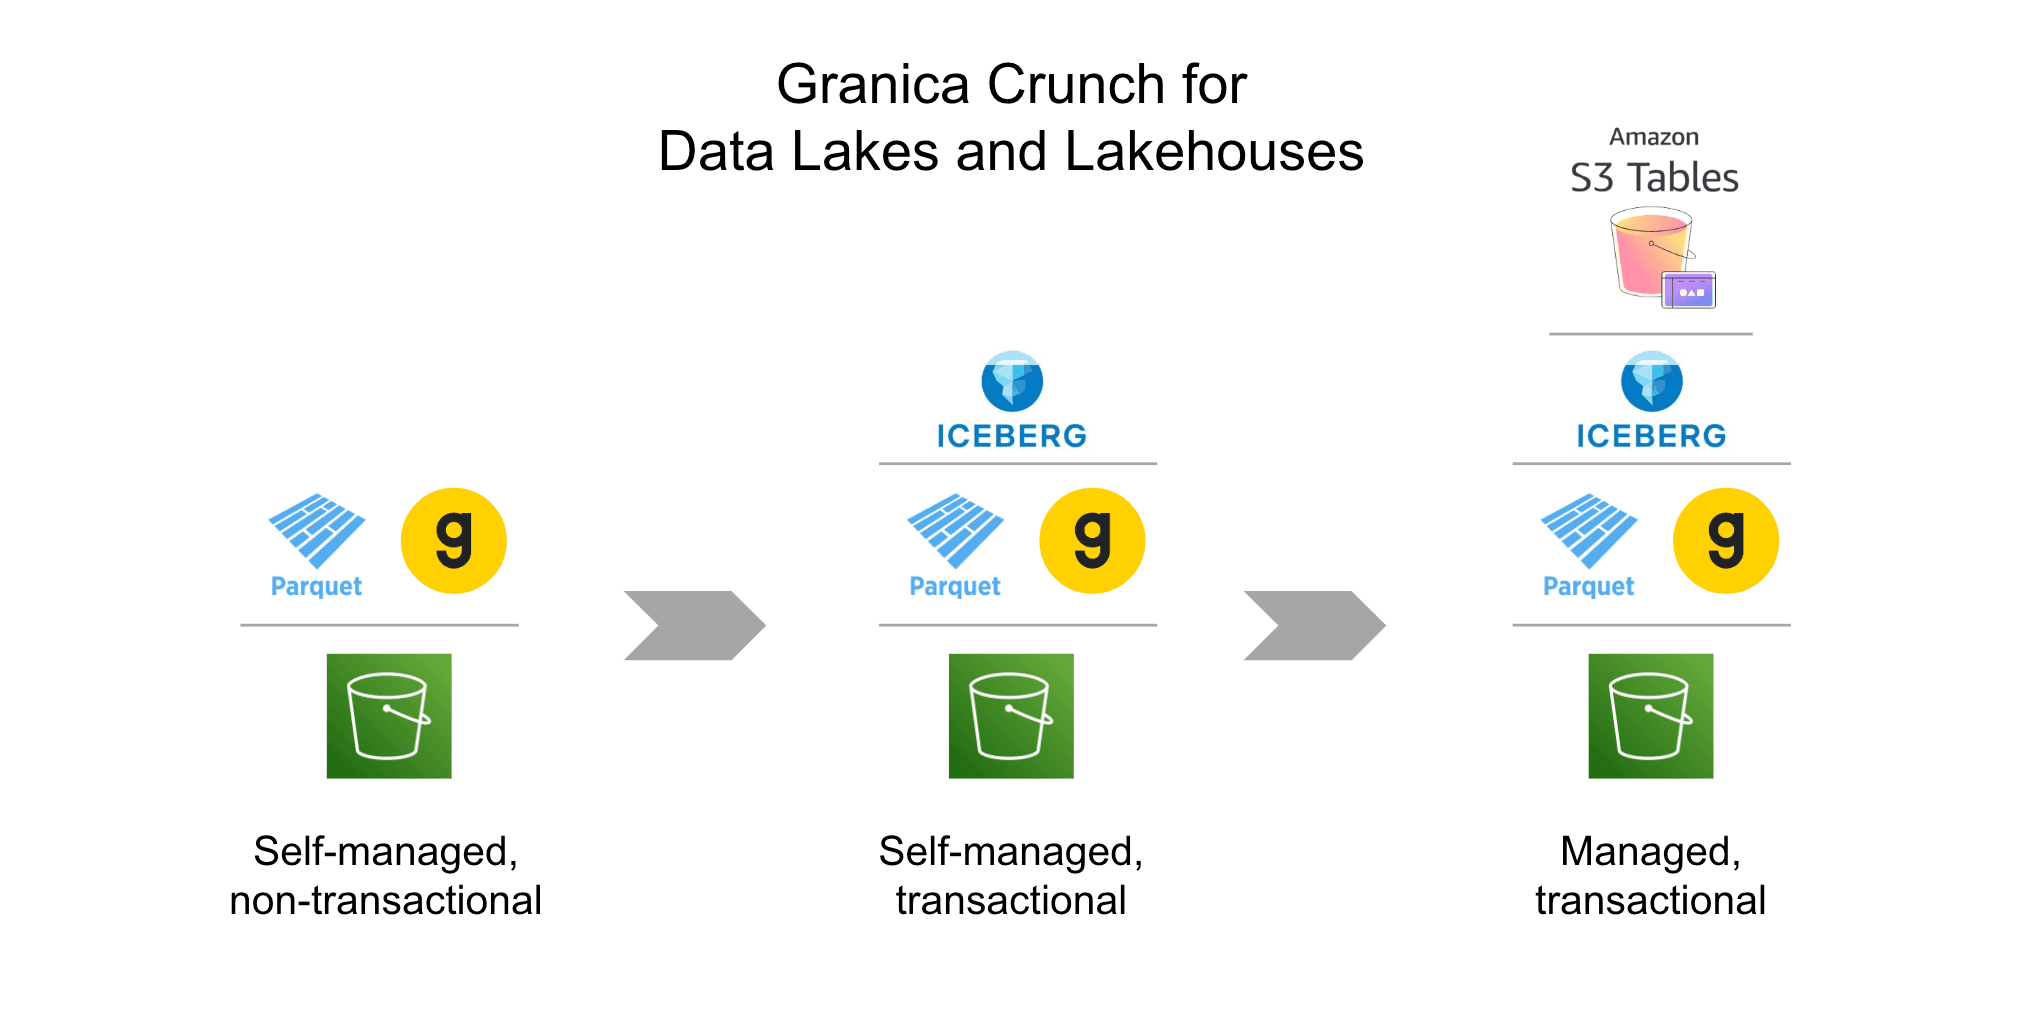
Leverage cloud cost analysis with Granica
The marketplace is full of tools for cloud cost analysis and data management, but only one platform provides deep data lake visibility, AI-powered cost optimization via data lake compression, and privacy preservation of training data for safe AI and LLM usage. Granica Chronicle AI offers a genAI-powered chat interface that generates powerful data and usage visualizations that empower actionable insights, without requiring SQL or CLI. When combined with Granica Crunch’s data lake compression service, organizations can visualize, analyze, store, and access data more efficiently from a single platform.
