The cloud offers incredible value for businesses looking to leverage AI and machine learning (ML), but it can lead to uncontrolled costs if organizations aren’t careful. The more resources an organization manages in the cloud, the harder it is to keep track of their associated costs across the cloud environment.
It’s especially challenging to keep all stakeholders and teams on the same page, as they may be unsure which cloud cost KPIs (key performance indicators) they’re responsible for measuring. The chart below shows just how complex enterprise-wide cloud spending reports can be.
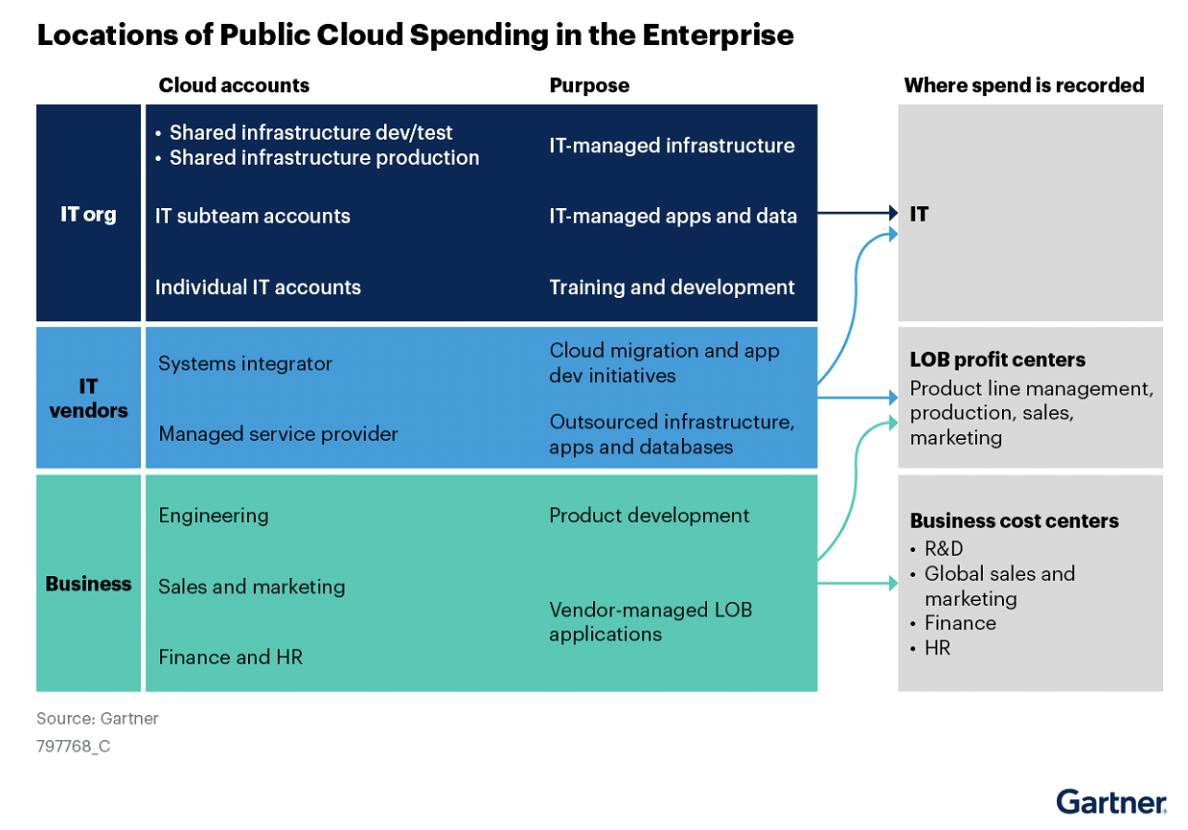
(Source: Gartner®, Control Cloud Costs with a FinOps Approach, by Ken Rothenberger, David Wright, February 27, 2024. GARTNER is a registered trademark and service mark of Gartner, Inc. and/or its affiliates in the U.S. and internationally and is used herein with permission. All rights reserved.)
Prioritizing these insightful cloud cost KPIs can help organizations encourage their stakeholders to track cloud costs and align them with core business values, which is the primary goal of FinOps.
Essential cloud cost KPIs
Organizations can track dozens of different cloud cost KPIs. The challenge is knowing which KPIs are worth tracking based on the organization’s resources and business values.
Tracking every possible KPI isn’t feasible, as they take time and resources to measure consistently. Instead, organizations should develop a custom KPI strategy to measure the most impactful cloud cost optimization initiatives.
As a baseline, organizations should track the following cloud cost KPIs.
| Cloud Cost KPIs | |
|---|---|
| KPI | What It Measures |
| GPU cost per hour/second | The average GPU cost per instance or virtual machine (VM). Remember to account for any reserved instance or commitment-based discounts. |
| Cost per GB stored per month | The average cost to store data in each data tier. Ensures only the most valuable data is stored in the most expensive tiers. |
| Cost per GB transfer | The average cost to transfer data. Break down costs by region, volume transferred, subscription tier, and other relevant measurements. |
| Resource utilization | The amount of resources currently utilized, expressed as a percentage of total allocated capacity. It’s important to compare this percentage to the predicted utilization rate. Tracking peak utilization rates separately from average rates offers deeper insights into cloud cost trends. |
| Unused resources | The percentage of unused cloud resources, like orphaned resources or snapshots. Ideally, this percentage should be as low as possible. |
| Unallocated shared CSP cloud cost | Total cloud costs that aren’t allocated to specific teams or stakeholders. FinOps principles encourage stakeholders to control their own allocated cloud costs, so it’s important to track uncontrolled costs that can’t be attributed to specific teams. |
| Cost of unallocated CSP cloud resources | The total cost of cloud resources that aren’t allocated to a specific team or stakeholder. Poor resource allocation makes it difficult to measure other cloud cost KPIs and may create cost inefficiencies, so it’s important to keep the rate of unallocated resources as low as possible. |
| Policy-compliant tagging of cloud costs and resources | The percentage of cloud costs and resources that are appropriately tagged according to an organization’s policy. Higher percentages make it easier to measure other cloud cost KPIs. |
| Cost of untagged CSP cloud resources | The percentage of untagged cloud resources, or resources that aren’t appropriately tagged according to company policy. This is often a continual process as organizations adjust tagging policies to meet new FinOps goals. |
| Commitment discount waste | The percentage of on-demand spend that could have been charged at a discounted rate (for reserved instances or committed-use discounts). Organizations should aim to use reserved instances at every opportunity. |
| Compute spend covered by commitment discounts | The percentage of cloud spend that the cloud service provider charged at a discounted rate due to reserved instances or committed-use discounts. |
| Unpredicted variance of spend | The variance between predicted cloud spend vs. actual cloud spend. This is where organizations can track unexpected cloud costs or anomalies. |
| Forecasted usage accuracy rate | The difference between the forecasted cloud usage vs. the actual cloud usage. Cloud usage includes metrics like the number of VMs or the number of data files in specific storage tiers. |
| Cloud budget burn rate | A percentage of the total allocated budget an organization burns through over a set period of time, and the speed at which it does so. Anomalies can cause high burn rates, but consistently high burn rates must be investigated more closely. Likewise, low burn rates may indicate underutilized cloud resources, though it can also signal effective cloud cost optimization. |
The list above is not comprehensive. However, it is an excellent starting point for organizations seeking to optimize cloud costs and promote widespread FinOps adoption among their teams. Together, these cloud cost KPIs offer valuable insights into cloud spending habits and the potential business value of allocated costs.
After organizations begin tracking these crucial cloud cost KPIs, they can leverage their insights using best-in-class cloud cost optimization tools.
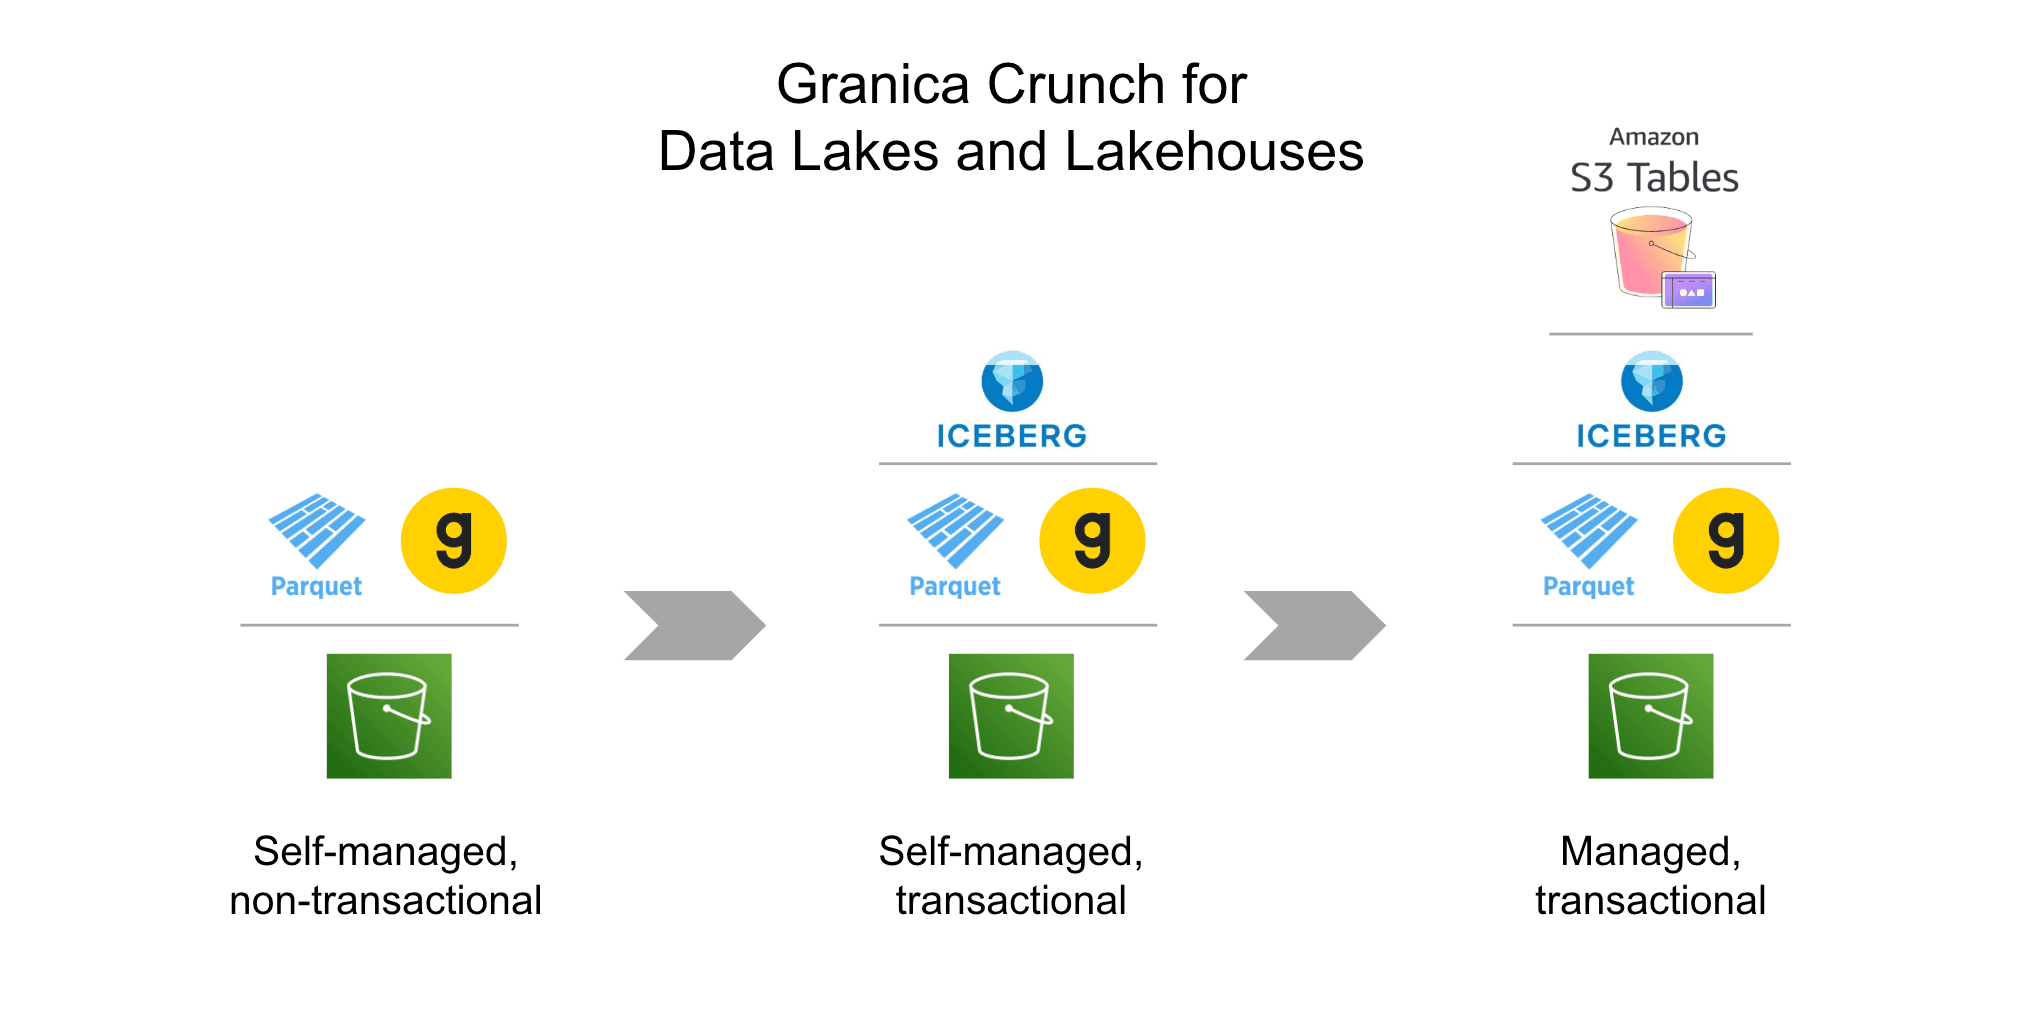
Optimize cloud data lake storage costs with Granica Granica helps organizations reach FinOps goals using powerful cloud cost optimization tools, including Granica Crunch.
Granica Crunch is a cloud data cost optimization service that reduces the size of data sets stored in cloud data lakes. Crunch uses lossless compression algorithms to shrink large data sets by up to 80% while also reducing data transfer costs in the process. This is especially useful for organizations that rely on large-scale AI training data sets.
Additionally, Granica Crunch uses machine-learning-powered compression algorithms that automatically and continuously compress files based on their structure and content. This frees up IT teams to pursue more complex FinOps goals.
With Granica, organizations can see an immediate improvement in cloud cost KPIs like cost per GB stored per month, GPU costs, and data transfer rates, all of which bring businesses closer to FinOps maturity.
Explore an interactive demo of Crunch to see meaningful improvement in valuable cloud cost KPIs and unlock the full potential of the cloud.